Published on: 10/10/2022 • 11 min read
Our Updated Market Outlook
The third quarter of 2022 saw financial assets continue their year-to-date decline with correlations between stocks and bonds elevated relative to historical norms. Additionally, during the quarter we saw a pullback in commodity prices. A deterioration in multiples and declining earnings expectations led to negative returns in U.S. large-cap and U.S. small-cap equities.
Developed international equities also fell as European markets faced higher energy costs and a negative reaction to the U.K.’s recent fiscal and monetary policy announcements. Emerging market equities were down 11.4% as rising inflation and questions about the Chinese economy weighed on returns. At the same time, a third consecutive rate hike of 75bps from the Federal Reserve put further pressure on bonds and led to a third-quarter decline in fixed income of 4.8%.
With this challenging macroeconomic environment and market performance, we think it is worth providing an update on our outlook for the next 12 months.
At Avidian, a mild recession is now our base case scenario, given a hawkish Federal Reserve. Further, we believe that investors will begin thinking more about the timing and duration of a potential recession as we move ahead.
Although the timing of our mild recession forecast remains fairly uncertain, we do foresee a shallow economic contraction that perhaps lasts a bit longer than prior recessions as the labor market remains strong and we see healthy balance sheets in place for consumers, corporations, and banks.
Inflation Outlook and Implications for the Economy and Markets
So far in 2022, investors have focused primarily on gauging inflation, assessing the labor market, and plotting what the Central Bank response might be under different scenarios. In our view, the outlook for inflation is crucial at this stage because the future path of global economic activity and market performance will be overwhelmingly shaped by how persistent inflation turns out to be
Take for example what we saw during the summer with CPI data, which tracks changes in prices over time.
The July CPI report gave investors hope that both headline and core inflation were moderating and would allow the Fed to slow rate hikes. However, the August CPI report significantly outpaced consensus expectations and reintroduced the idea that the Fed would continue raising rates aggressively. This led to renewed volatility across asset classes as higher interest rates were reflected in securities prices.
As we look ahead, we expect goods inflation to slow further, due to lower commodity prices, easing supply chain issues, and shifting demand from goods to services. Our view is supported by softening prices in several high-frequency indicators like the PMI suppliers’ delivery times.
Nonetheless, it will take time for easing input prices to filter through to consumer prices.
Service inflation, on the other hand, remains robust as a tight labor market persists, and healthy wage growth remains. Consider for a moment that we have 1.87 job openings today, for each job seeker and the number of people quitting their jobs remains elevated.
While this is a positive for job seekers, for markets, good news on the labor front is bad news as it means the Fed likely needs to do more to further tighten financial conditions and rein in inflation.
But not all news is bad news. Once the Fed signals a pause in rate hikes or even a pivot as some have called for, we should see considerable upside for risk assets which historically tend to perform well once inflationary pressures ease.
Updated Fed Messaging and Economic Impact
During the September FOMC meeting, Fed officials hiked the fed funds rate by 75 basis points and reiterated their willingness to do whatever it takes to win the battle on inflation. This, as the Federal Reserve executes its fastest rate hiking cycle since the early 1980s. That pronouncement helped boost expectations for a steeper rate-hiking path over the coming months. In fact, the Fed is now projecting interest rates reaching 4.6% in 2023.
Moreover, the Fed is pushing ahead with its quantitative tightening program, reducing its balance sheet holdings of bonds at a pace of $95 billion per month, which is yet another form of policy tightening.
With the Fed communicating that it is willing to tolerate some economic pain, it further increases the likelihood that they might be accepting of a shallow recession. Of course, the stakes are high because monetary policy works with a lag, meaning that changes to interest rates today can take a year or more to have a significant impact on the economy. Since we have seen a rapid tightening already, it is quite likely that the impact won’t be known for many months.
Finally, we would be remiss to not mention that this is the first time in quite some time that we are seeing monetary policy tightening occurring simultaneously across the globe. Synchronized but less coordinated policy tightening may also lead to unintended consequences at some point by disrupting the normal functioning of financial markets and investors should be watching this closely.
Uncertainties Around Fed Policy That Could Drive Near-Term Asset Performance
As is usually the case, asset performance is influenced by key economic drivers. Yet, this time around, they will be driven by clarity on three key questions.
First, how much economic pain is the Fed willing to unleash before it pauses, or pivots, from its current focus on crushing inflation? After all, there is a very clear tradeoff in play right now – rein in inflation at the cost of economic growth or let the economy grow but live with elevated inflation numbers.
Second, if the Fed remains steadfast in its pursuit of lower inflation, how quickly could they realistically get that number closer to their 2% target?
Lastly, at what point will the Fed be forced to acknowledge the impact on the world economy of structural inflationary forces like demographics, deglobalization, and decarbonization?
Outlook on Stocks
We can break the price return of stocks into two components: expected earnings growth and changes in price/earnings multiples.
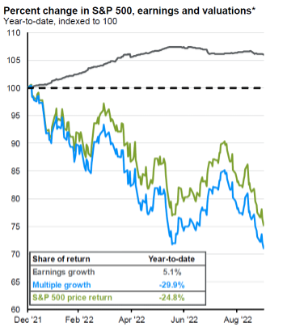
On the chart below, you can see that so far, the approximately 25% YTD drawdown for the S&P 500 index has been driven almost entirely by falling multiples, while analysts’ earnings forecasts remain positive. From a valuation perspective, the chart also tells us that stocks are 5%-6% cheaper than their long-run average, especially if you exclude mega-cap growth stocks, which remain more expensive.
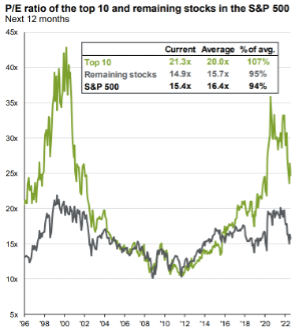
On the chart to the right, you can see that so far, the approximately 25% YTD drawdown for the S&P 500 index has been driven almost entirely by falling multiples, while analysts’ earnings forecasts remain positive. From a valuation perspective, the chart also tells us that stocks are 5%-6% cheaper than their long-run average, especially if you exclude mega-cap growth stocks, which remain more expensive.
As investors, it is important to remember that cheaper valuations improve future expected returns.
While higher real yields and investors’ risk aversion can certainly compress valuation multiples further, we think further pressure on stock prices is more likely to come from earnings downgrades we may see over the next few quarters. While wage pressures and rising input costs have increased rapidly in 2022, analysts’ earnings expectations for 2022 and 2023 have only seen marginal declines since the beginning of the year. This appears to reflect a belief that companies will be able to pass higher costs along to consumers.
However, we see some potential for profit margins to face greater pressure from here. Although aggregate 2Q earnings were better than expected, when we strip out energy sector earnings, aggregate earnings fell nearly 4%. Add to that the risk of declining job growth and possible fiscal drags, and it is not difficult to see a headwind for consumer spending and corporate profits.
Historically, both corporate profits and profit margins have declined in advance of recessions. This leads us to believe we are likely in the early stages of this process. That said, even though we do see a contraction in earnings, we do not see a collapse in earnings typically associated with recessionary periods. The reason is that in an inflationary environment as we are in today, earnings tend to hold up better as they are measured in nominal terms, as inflation would help keep revenue growth positive despite rising costs.
Outlook on Bonds
We have an increasingly constructive view of core bonds. Bond yields, especially for high-credit quality bonds, now look more attractive than they have for quite some time.
The chart below illustrates how yields today are near the top of the range when compared to yields we have seen over the last ten years. Given our view that the market’s focus is likely to shift from inflation to growth as we move ahead, core fixed income could offer downside protection.
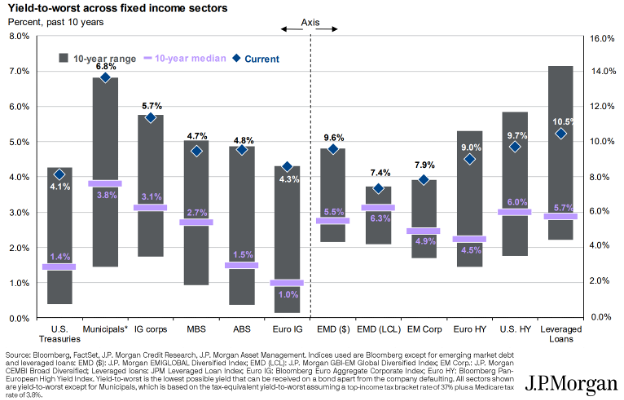
As an example, if a U.S. recession does materialize and the 10-year Treasury yield drops from approximately 3.50% to 2.50%, we would expect U.S. investment-grade bonds to return about 11%. If instead, we see the 10-year Treasury rise to 4%, U.S. investment-grade bonds would likely be flat.
To us, this looks like a favorable risk-reward for fixed-income investors at this stage in the cycle.
US Dollar Outlook
Recently, we have seen a surge in the value of the US dollar. We see a long list of drivers behind this move, including widening real interest rate differences, weaker international growth, and rising risk aversion. Investors should be paying attention to the US dollar as it is an important determinant for the direction of global financial markets. Today, we remain cautious about risk assets because we have seen global U.S. dollar money supply growth turn negative on a year-over-year basis.
A stronger dollar has various implications for the global economy and portfolio strategy. On the upside, a strong dollar could help curb inflation domestically by making imports cheaper. On the downside, a strong dollar pressures earnings for large US multinational companies, as their international sales become less valuable at home. In addition, a strong dollar tends to export inflation overseas, as dollar-denominated goods and commodities become more expensive for other countries. This is one reason why we lean more heavily on US stocks compared to international stocks today.
However, the strength of the US dollar may reverse the trend eventually as the dollar is fundamentally overvalued, a condition which has been amplified further this year. As a result, in the long run, we do expect the US dollar to depreciate, which will increase the attractiveness of international equities.
On top of that, more attractive valuations in international equities may drive international equities to eventually outperform. It will require some patience for this to play out.
Things to Keep In Mind
We know that patience can be challenging in the face of drawdowns. However, it is important to remain invested. History certainly supports this view. Since 1980, there have been 51 days during which the S&P 500 dropped more than 4% in a single session.
After each of these instances, the market went on to recover and make new highs. In the past 20 years alone, the S&P 500 has annualized 9.7%, but missing just 10 of the market’s best days, which tend to occur within less than one month of the 10 worst days, would have reduced that annualized return to 5.5%.
While markets have bad days, weeks, and even years, history suggests that you are less likely to suffer losses when a diversified portfolio is held for longer periods of time. The chart below shows that while rolling 12-month stock returns have varied widely since 1950 (from +60% to -41%), a 50/50 blend of stocks and bonds has not suffered a negative annualized return over any five-year rolling period in the past 70 years.
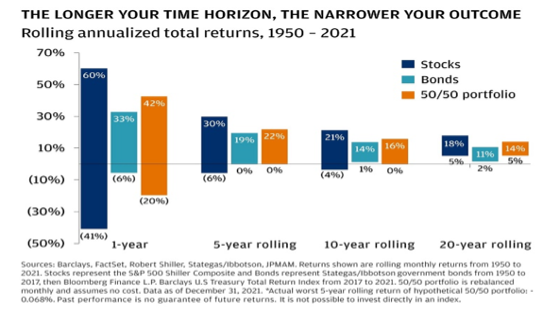
That’s quite a record and supports the claim that the longer you stay invested, the more certain you can be about the range of outcomes. In the short term, however, the range of outcomes can be wide. This means that even though our base case calls for a mild recession, there are several different scenarios that could emerge. It is why we continually monitor and adjust portfolios as needed when we get new data.
Regardless, it is always difficult to know where the bottom is. However, from a historical perspective, bear markets that have overlapped with recessions have averaged a decline of 33% over a 17-month period. Excluding the pandemic-induced recession of 2020, the current bear market is tracking the last six bear markets leading to recession closely.
With that in mind, the historical analysis does suggest that while it is possible to see a bit more downside from here, we are likely closer to the bottom than we are from the top. This means that it is probably too late to raise cash.
Instead, investors should use lower securities prices to dollar cost average and look for opportunities. After all, we could see upside for risk assets as catalysts like a drop in core inflation numbers, fewer corporate earnings downgrades, or a weaker US dollar materialize.
This is especially true as we consider the amount of negative sentiment priced into asset prices today. Today, we see pessimism among individual investors at levels not seen in more than a decade.
Negative sentiment is often considered a contrarian indicator for the US stock market and is often at extreme bearishness before a more bullish move. While it may be counter-intuitive, this is a sign that we may not be too far from a market bottom.
Please read important disclosures here
Get Avidian's free market report in your inbox

Schedule a conversation
Curious about where you stand today? Schedule a meeting with our team and put your portfolio to the test.*