Published on: 08/05/2022 • 7 min read
Avidian Report – Are We In A Recession and What Does It Mean For Stocks?

INSIDE THIS EDITION
Are We In A Recession and What Does It Mean For Stocks?
Many of our readers have probably wondered whether we are already in a recession considering all the talk of one for the last couple of months, especially in the mainstream media. After all, many investors equate recession with scary things like job losses, lower profits, and stock market declines. To begin answering the question of whether we are in a recession, let’s look at a few data points.
First, let’s talk about the Fed’s most recent monetary policy decision. As many investors are aware, the Fed decided to raise the policy rate by 0.75% last week and provided their assessment of the economy in their post-decision commentary. The commentary cited that spending and industrial production had softened while the job market remained robust. The Fed also commented that inflation continued to reflect supply and demand imbalances which have been the case since COVID emerged. They also restated their commitment to data dependency while not issuing specific forward guidance. This was reassuring for the equity market as it assured that they would shy away from blindly hiking the policy rate at future meetings without regard for the economy. The takeaway is that the Fed would be measured and on the lookout for recession, which for now they don’t see.
And truthfully, we agree with their assessment. Let’s consider the chart below.
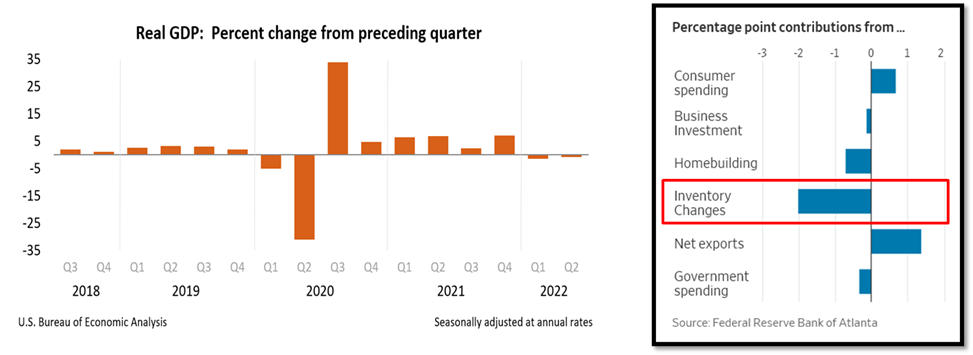
On the left side of the chart, we see quarterly percent changes in real GDP going back to 2018. Real GDP in the first quarter of this year fell 1.6% and was the first negative print going back to the COVID- induced decline in the second quarter of 2020. That was followed by a second-quarter decline of 0.9%. And these back-to-back negative Real GDP prints are what have people debating whether we are in recession, to begin with. While at face value, this would meet the requirement for a technical recession, it is important to realize that these GDP numbers are subject to future adjustment. As we see it, the likelihood that a revision changes the second quarter number is high. The reason is that the impact of inventory changes in the second quarter was -2.00%. Said another way, if we strip out the inventory changes, real GDP for the second quarter would have been positive and all talk of a technical recession would likely go out the window.
It is also worth mentioning that the National Bureau of Economic Research (NBER), which makes the final call on recessions, looks at 6 key data points when determining whether we are in a recession. They are nonfarm payrolls, household surveys, real personal income (fewer transfers), real PCE, industrial production, and real manufacturing. If we look at each of those data points over the last 7 months, 5 of them remain in the non-recession territory.
With recession talk off the table, for now, investors have turned their attention to whether this will change in the coming quarters. While it is impossible to say with any certainty, there are some valuable indicators that historically have done a good job providing clues of a future recession. However, one caveat is that they are not perfectly predictive and tell us little about the exact timing of the recession.
Let’s consider the inversion of the yield curve. This is when the longer-term yield falls much faster than short-term yields. Historically this is perhaps one of the best early warning signs for recession and while it can’t tell us precisely when and how deep, it does provide a tool for assessing probabilities of recession as we move ahead. Today, we have 48% of yield curve segments inverted. What the data shows us is that when 50% or more of yield curve segments invert, we tend to get recessions. Although we are getting close to that 50% threshold like we did in 2008 and again in 2020 before our last recessionary periods, we aren’t quite there yet either.

However, the probabilities are rising for a recession at some point over the next 12 months. In fact, as the chart below illustrates, the yield curve sees those probabilities up significantly during July, to 13.2%. While not representing a super high probability, risks are rising, and the data must be monitored closely.

Perhaps this is a good time for a reminder: recessions and market drawdowns are not the same. Markets are forward-looking with securities prices reflecting expectations for the future. Understanding what is being priced into the market, can help identify possible scenarios and market impacts. Just as an example, we can see what is being priced into the market as it relates to interest rates. We can focus on interest rates here because today interest rates have a disproportionate impact on the trajectory of asset prices. As the chart below shows, we see the 75bps rate hike for July and as we move to the right along the x-axis, we see in the light blue shaded boxes the expected rate hikes being priced into markets today. You will notice that for September, the market is expecting only a 0.59% hike, for November an even smaller 0.29% hike, and in December a smaller 0.10% hike. By the end of 2022, the market expects rates to end up at around 3.31%.
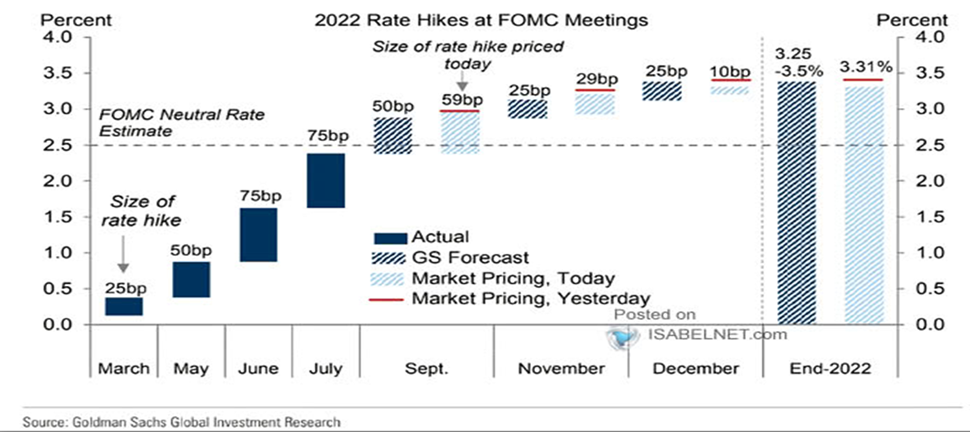
The key takeaways for investors are two-fold. First, we are getting closer and closer to the FOMC neutral rate estimate marked by the dotted horizontal line in the chart above. Second, and perhaps more importantly for markets is that the recent rebound in securities prices is reflecting a slower pace of future rate hikes through the end of the year and a potential Fed pivot. For risk assets, this likely means that if interest rates are hiked more aggressively than what is shown in the chart above, we probably see a market decline. Of course, it cuts both ways, also meaning that if the Fed becomes more dovish than this data suggests, then perhaps a more favorable return environment awaits equity investors until the end of the year.

Disclosure:
Avidian Wealth Solutions is a registered investment adviser. The information presented is for educational purposes only and does not intend to make an offer or solicitation for the sale or purchase of any specific securities, investments, or investment strategies. Investments involve risk and, unless otherwise stated, are not guaranteed. Be sure to first consult with a qualified financial adviser and/or tax professional before implementing any strategy discussed herein. Past performance is not indicative of future performance.
Avidian Wealth Solutions may discuss and display, charts, graphs, and formulas that are not intended to be used by themselves to determine which securities to buy or sell, or when to buy or sell them. Such charts and graphs offer limited information and should not be used on their own to make investment decisions.
Please read important disclosures here
Get Avidian's free market report in your inbox

Schedule a conversation
Curious about where you stand today? Schedule a meeting with our team and put your portfolio to the test.*