Published on: 07/21/2022 • 4 min read
Avidian Report – Could A Fed Interest Rate Pivot Be In The Cards?
INSIDE THIS EDITION
Could A Fed Interest Rate Pivot Be In The Cards?
The last few days have provided some respite for investors tired of this year’s asset price declines. In fact, over the last week, major indices like the S&P 500 and NASDAQ have indicated a few back-to-back positive days for the first time in a while. This, perhaps unsurprisingly, is at a time when investors have taken down risk levels to levels not seen since the height of the Great Financial Crisis in October 2008.

Perhaps this is due to the growing consensus that recession is likely. The latest findings from Bank of America show that nearly 60% of survey respondents believe a recession is expected. This substantial year-to-date increase is the highest level since April 2020, when COVID roiled markets and the economic outlook soured.

With economic concerns rising, many investors now wonder whether the Federal Reserve will hike interest rates further. While the case might be made that the Fed will continue being hawkish as they attempt to control inflation, we may be getting closer to the point where the Fed takes a pause or even pivots to cutting rates. And we are not suggesting it will be during the next Fed meeting, but some data suggests a break or pivot might be in the cards at some point during the coming quarters.
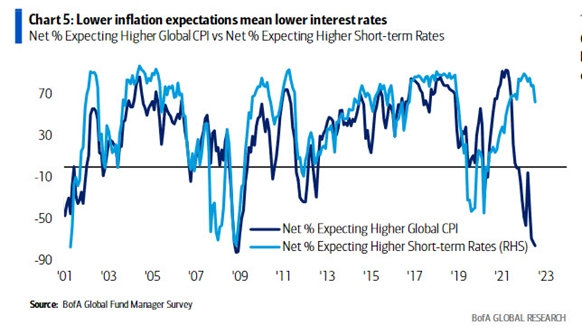
First, we see signs that global inflation expectations are receding. Lower inflation expectations typically mean lower interest rates as the need for aggressive hikes to control inflation is reduced. The chart below shows that the net percentage of Global Fund managers surveyed by Bank of America Global Research expecting a higher Global Consumer Price Index has declined sharply. Yet, expectations for higher short-term rates remain elevated. If the historical relationship holds, we believe this divergence narrows with a decrease in rates.
And we may be starting to see the yield spread point to a similar flattening of yield expectations ahead. As the chart below indicates, the three-month/10-year real US treasury yield curve which looks ahead 12 months is showing signs of stalling out after an impressive increase over the last 6 months. Yet, another sign that the market may be looking ahead to a pause or cutting phase from the Federal Reserve.

All of this is only supported by copper, which gets its Dr. Copper nickname because, in the past, it has been able to diagnose the state of the economy reasonably reliably. When copper prices have declined, it often signaled weakening global economic activity. When the economy slows, it is more likely that the world’s central banks will loosen monetary policy to kickstart the economic engine.
The chart below shows the copper/gold ratio overlayed on top of the 10-year treasury yield. While these have closely tracked one another in the past, more recently, the lines have moved in opposite directions. Very similar to the inflation expectations and interest rate chart above, at some point, this divergence may close with interest rate hikes at some point narrowing the gap.

Disclosure:
Avidian Wealth Solutions is a registered investment adviser. The information presented is for educational purposes only and does not intend to make an offer or solicitation for the sale or purchase of any specific securities, investments, or investment strategies. Investments involve risk and, unless otherwise stated, are not guaranteed. Be sure to first consult with a qualified financial adviser and/or tax professional before implementing any strategy discussed herein. Past performance is not indicative of future performance.
Avidian Wealth Solutions may discuss and display, charts, graphs, and formulas that are not intended to be used by themselves to determine which securities to buy or sell, or when to buy or sell them. Such charts and graphs offer limited information and should not be used on their own to make investment decisions.
Please read important disclosures here
Get Avidian's free market report in your inbox

Schedule a conversation
Curious about where you stand today? Schedule a meeting with our team and put your portfolio to the test.*