Published on: 06/24/2022 • 5 min read
Avidian Report – Could Fund Flows Signal a New Normal?

INSIDE THIS EDITION
Could Fund Flows Signal a New Normal?
Investors often hear discussions about fund flows as an important data point. Fund flows reveal much about current investor behavior and sentiment. This can have significant implications for asset performance because as fund flows increase to investment vehicles like ETFs, the capital must be deployed to the securities in the fund’s target basket. Further, there can be insights as we look at flow data across asset classes.
Several weeks ago, we talked about investor sentiment and how it had become increasingly bearish. However, investor positioning remained highly weighted toward equities, as shown in the following chart. Despite the blue line representing U of Michigan Consumer Sentiment declining sharply, equity positioning marked by the orange line remained nearly unchanged, which we believed at the time would have to converge either from a decrease in risk positioning or improving sentiment that would support such a high allocation to equities.
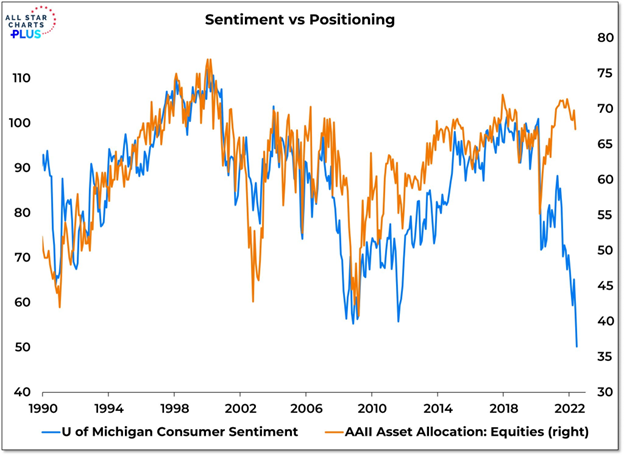
Source: All Star Charts Plus
As a result, this week, we dig deeper across asset classes to see if the spread between sentiment and positioning is narrowing, which could help stabilize markets.
The following chart is an excellent place to start our survey, showing fund flows between risky and safe assets. Risky assets can be stocks, while safe assets might be considered fixed-income securities like US treasuries. A counter-trend may develop with increased fund flows to risky assets. This move does little to close the gap mentioned above between sentiment and positioning. However, some investors may be dip buyers trying to take advantage of valuations that look far more attractive than in the past.

However, selectivity remains essential as profit margins and overall corporate profitability may suffer over the next quarter or two, making declining P/E multiples appear not as low as they are. Now, that is not to say there are no available opportunities, but it is instead a warning that sometimes things in the market can get less expensive for a reason, and eliminating those potential traps is increasingly important in the current environment.

What we see in fund flows across geographies provides interesting insights for the geographically-diversified investor. Geographic diversification over long periods can smooth portfolio volatility, but geographic leadership can shift, sometimes depending on the geopolitical and macroeconomic regime at a given time.
The chart below shows that fund flows overwhelmingly flow to US equities and funds with a more global investment mandate. At the same time, and perhaps unsurprisingly, flows have been negative to European equities as they continue to face headwinds because of the Ukraine/Russia conflict and a growing energy crisis in much of Europe.
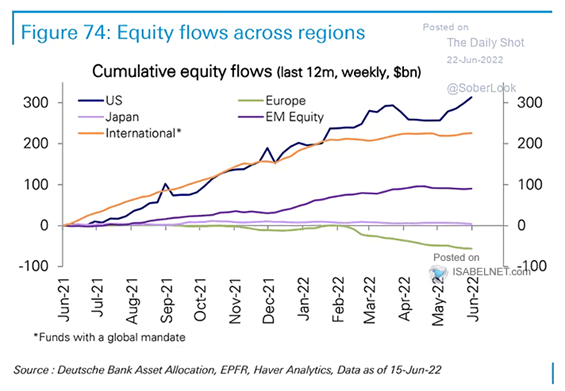
Perhaps surprising to some investors is how positive fund flows have done little to boost returns to US equities. Even over the last month, month-to-date performance for broad US indices and industries has dropped substantially. Every major S&P 1500 sector and industry has been down over the past month.

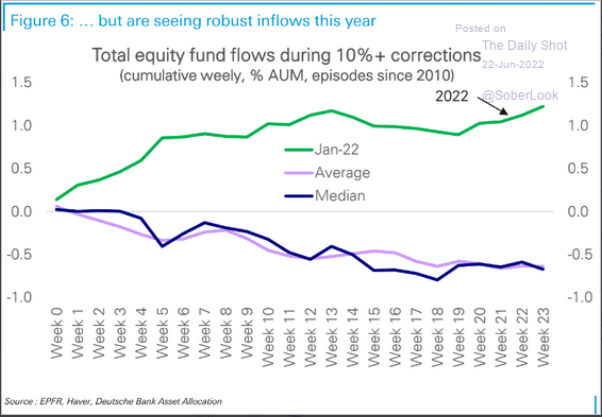
Equally, if not more, surprising is that equity fund inflows have continued increasing despite dismal year-to-date returns, as drawdowns tend to lead to outflows as investors move to de-risk portfolios.
We are in a very different environment from what we are accustomed to during market drawdowns of more than 10%. Usually, inflows turn negative, and we get market environments where outflows are the dominant feature.
Perhaps these data points regarding fund flows should make investors question whether the continued monetary stimulus and support from the Federal Reserve and other major central banks over the last decade have changed the reaction function for investors and what impact it has on the trajectory of the market recovery.
Disclosure:
Avidian Wealth Solutions is a registered investment adviser. The information presented is for educational purposes only and does not intend to make an offer or solicitation for the sale or purchase of any specific securities, investments, or investment strategies. Investments involve risk and, unless otherwise stated, are not guaranteed. Be sure to first consult with a qualified financial adviser and/or tax professional before implementing any strategy discussed herein. Past performance is not indicative of future performance.
Avidian Wealth Solutions may discuss and display, charts, graphs, and formulas that are not intended to be used by themselves to determine which securities to buy or sell, or when to buy or sell them. Such charts and graphs offer limited information and should not be used on their own to make investment decisions.
Please read important disclosures here
Get Avidian's free market report in your inbox

Schedule a conversation
Curious about where you stand today? Schedule a meeting with our team and put your portfolio to the test.*