Published on: 06/10/2022 • 7 min read
Avidian Report – Has The Market Bottomed

INSIDE THIS EDITION
Has The Market Bottomed
Back in April, we identified several uncertainties that the market had to overcome before a path to a higher equity market would open. Three key uncertainties we outlined were the war in Ukraine, China’s COVID policy, and inflation. And as we have seen since February, the news flow related to these uncertainties has largely driven overall market performance and the decline for both stocks and bonds year-to-date which makes sense considering the connection between them and fed policy, liquidity, financial conditions, and economic growth.
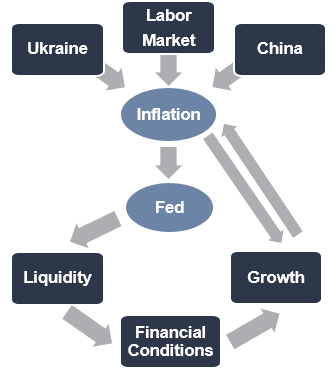
Source: Avidian Wealth Solutions
As a result of the decline, many investors are now wondering whether the markets have bottomed, and for good reason. And although it is an impossible question to answer definitively, we can look to several data points that have historically pointed to a market bottom.
Corporate activity
Global IPO Activity

As the chart above shows, the global IPO market has cooled. Both in terms of the number of IPOs and the dollar value. When investors look at this data, they can simply think about who has the best estimate of a company’s intrinsic value. More likely than not, it is the management of the company itself. That means that when they believe they are likely to raise more capital through an IPO because of a frothy market, they are more likely to do so via IPO. Otherwise, they may be happy holding onto private shares as they hold out for a better time. As the chart above clearly depicts, IPO activity was strong in 2020 and has cooled dramatically since then. Typically you will reach a bottom, or at least close to it, when the IPO market dries up. And signs are starting to emerge that we might be getting much closer to that point.
Bloomberg Corporate Bankruptcy Index

Then of course we have corporate bankruptcy data. When a recession is coming or a major crisis looks imminent, lenders begin to worry about the repayment of principal and interest from corporate borrowers. As a result, we see weaker companies begin to show signs of stress and more importantly an inability to refinance their debt. As a result, bankruptcy curves can spike as they did during the great financial crisis. Today, the picture looks very different from what it looked like then, as the strength of corporate balance sheets has kept the bankruptcy index at or near all-time lows and provides an opposing signal to what the IPO market is telling us. Time will certainly tell how the Bankruptcy curves evolve in the coming months, but investors should keep a watchful eye on this data as they could signal an economic inflection point in either direction.
Valuation

Source: JP Morgan
The chart above shows you several valuation metrics for the S&P 500 while the chart below shows you the price level.
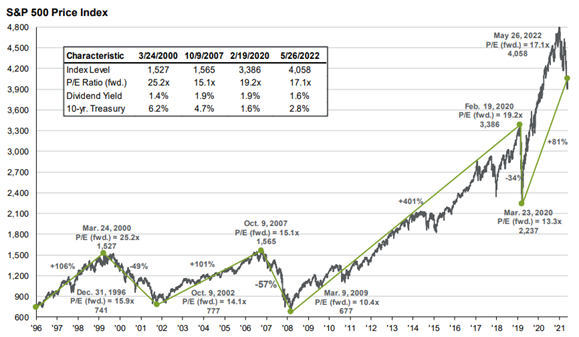
Source: JPMorgan
Although these charts have a lot going on in them, there are three key things they are telling investors today. First, they highlight the speed of valuations contractions. For example, we see valuations peaking at around 22x during our post-recent market peak before very quickly correcting to the 25-year average of around 17x. We can compare this to when the dot com bubble burst in the early 2000s and see that our most recent correction occurred nearly 3x as fast. Second, is that current valuations are not as expensive as they were at the beginning of the year and if we use history as a guide, we see they are fairly valued. Lastly, is when we might expect going forward. We continue to believe that inflation and the interest rate regime will be key determinants for how the next leg of the market progresses. And we also know that as valuation levels drop, expected future returns improve and mean that we may be closer to a market bottom.
Sentiment

The next data point is one we have covered in detail over the last several market reports. However, we do want to highlight that retail investor sentiment can have sway in the market. As investor sentiment becomes more bearish, it tends to serve as a contrarian indicator that could signal a bottoming process. As we look at the data in the chart above, we observe the red line telling us the magnitude of bearish views from the retail investing community. Today, we are at a level of bearishness that exceeds what we saw in early 2020 when the global economy virtually shut down. As a result, we interpret this data as telling us that a lot of bad news is already being priced into the market and could be indicating that the market could be close to bottoming.
Economic Outlook
With some signs of bottoming potentially in sight, what is our near-term outlook? Again, we can use history as a guide. First, we can look at equity performance from a seasonal perspective. Typically, May through October is the weakest period for equity performance.

The chart above shows that those months typically deliver the lowest return which makes sense as we consider that during summer months, traders tend to de-risk. Bonds on the other hand tend to have stronger performance.

As many investors are aware, we are nearing mid-term elections. So from an election cycle perspective, we tend to see weakness during this period as a great deal of political uncertainty and policy implications loom large over the market. However, once those uncertainties begin to clear, we often have the year of strongest market performance during a 4-year election cycle. As we put that together with the uncertainties that remain around inflation, the China COVID story, and the US economic growth outlook, our best guess is that in the near-term we may have limited upside and continued volatility. However, we think we could see a strong rebound should uncertainties clear and once the mid-term elections are behind us.

Disclosure:
Avidian Wealth Solutions is a registered investment adviser. The information presented is for educational purposes only and does not intend to make an offer or solicitation for the sale or purchase of any specific securities, investments, or investment strategies. Investments involve risk and, unless otherwise stated, are not guaranteed. Be sure to first consult with a qualified financial adviser and/or tax professional before implementing any strategy discussed herein. Past performance is not indicative of future performance.
Avidian Wealth Solutions may discuss and display, charts, graphs, and formulas that are not intended to be used by themselves to determine which securities to buy or sell, or when to buy or sell them. Such charts and graphs offer limited information and should not be used on their own to make investment decisions.
Please read important disclosures here
Get Avidian's free market report in your inbox

Schedule a conversation
Curious about where you stand today? Schedule a meeting with our team and put your portfolio to the test.*