Published on: 01/21/2022 • 4 min read
Avidian Report – Is The Market Decline Here to Stay?

INSIDE THIS EDITION
Is The Market Decline Here to Stay?
Financial Planning Ideas – Build Back Better Edition
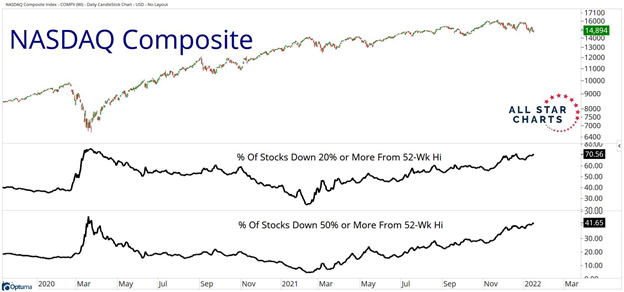
Over the last couple of weeks, we have mentioned a stealth correction occurring in equity markets. This is best described as a correction in underlying stocks while major indices remain relatively unchanged thanks to the strength and support of a handful of names. However, this past week it seems like the stealth correction in some asset classes and sectors has finally started to affect index levels.
Take a look at the NASDAQ Composite chart below which is divided into 3 panels. The top panel shows the index level. A bit of a move lower to start the year as inflation and interest rate fears have slowed the advance seen during the totality of 2021. The middle panel shows the percentage of stocks from the NASDAQ down 20% or more from their 52-week high at nearly 71% while the bottom panel shows the percentage of stocks down 50% or more from their 52-week high at nearly 42%.

Source: All Star Charts
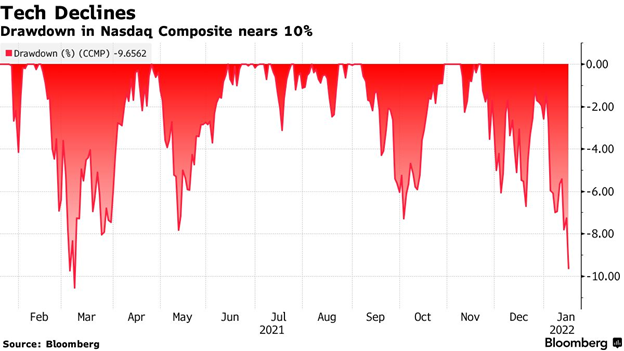
Just looking at this chart tells us that the NASDAQ is in a correction. In fact, even at the index level, the tech-heavy NASDAQ Composite is down nearly 10%. A drawdown of 10% is technically what is considered an official correction.

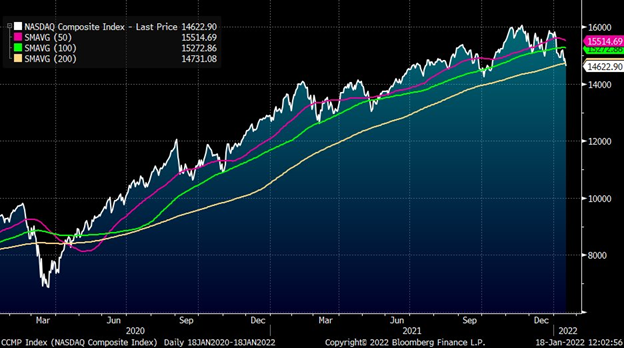
With an official correction within sight, it should not surprise anyone when we look at market technicals, at least for the NASDAQ, that things look fairly bearish. The chart that follows shows the NASDAQ Composite Index and three sets of simple moving averages. What we see is the price level of the index now breaking below the 200-day simple moving average. Clearly, the technical picture has deteriorated quite a bit over the three prior weeks.

Source: Twitter@LizYoungStrat
And the drawdown has not been limited to technology. In fact, even when we look at micro and small-cap stocks where many investors believe the best long-term opportunities for generating alpha lie, they are down to start the year as well.

Source: TradingView
And with shares in small-cap ETFs like IWM hitting technical support multiple times over the last year some investors may be concerned that the bottom could simply fall out and lead to a sharper decline if support does not hold this time as it has on several occasions since the start of 2021.
However, we think this is unlikely. Instead, we think this is merely a healthy correction across some swaths of the market. If it is in fact, then it is possible that there is some more upside ahead.
Especially if we take the sentiment indicators as a guide. As the chart below shows, whenever sentiment declines as it has of late, forward returns tend to be pretty decent.

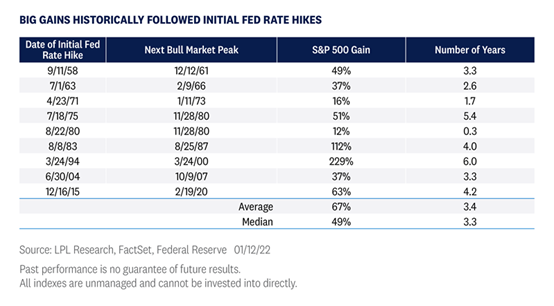
And this is despite all the talk of rate hikes. In fact, while volatility may certainly pick up around the topic of rate hikes, the historical record shows that big gains tend to follow initial Fed rate hikes.
Perhaps this time is different. But perhaps it isn’t. And if it isn’t different then we think investors should focus on asset class diversification, geographic diversification, and discipline to not only weather volatility but also take advantage of it.

Weekly Global Asset Class Performance

Please read important disclosures here
Get Avidian's free market report in your inbox

Schedule a conversation
Curious about where you stand today? Schedule a meeting with our team and put your portfolio to the test.*