Published on: 02/25/2022 • 8 min read
Avidian Report – Reminders During Market Shaking Geopolitical Events
INSIDE THIS EDITION
Reminders During Market Shaking Geopolitical Events
The Lowdown with Michael Smith, Special Guest Burl East
With the movement of Russian troops into Ukraine on Wednesday evening, it is now clear that geopolitical tensions have reached a boiling point in Eastern Europe. It has also led investors to pose difficult, hard-to-answer questions including what the NATO response will be, what the impact of sanctions might be to an already undersupplied oil market, and whether changes should be made to their portfolio allocations.
For now, we believe the correct course of action for most investors is to closely monitor how the situation in Ukraine unfolds and resist the temptation to be highly reactionary. On Thursday we had a perfect example of why this is often the correct action as the S&P 500 opened down more than 2% only to swing back to positive territory by market close.
That said, we acknowledge that oftentimes not reacting emotionally to market movements is excruciatingly difficult and goes completely against our fight or flight response. This time perhaps more than any time in the recent past as investors simultaneously wrangle with additional uncertainty over looming interest rate policy normalization.

To fight these reactionary urges, we believe that investors must look at both hard data and the historical record to put fear, uncertainty, and volatility into context while answering some basic questions. Namely, how much of the world’s economic activity is represented by Russia and Ukraine, How much revenue exposure of the S&P 500 is tied to these economies, and historically what has happened to the market after war breaks out.
In this week’s report, we will address these questions and more while maintaining the assumption that the conflict cools in the coming days and weeks.
How much of the world’s economic activity is represented by Russia and Ukraine?
As investors know, the economy is as global and interconnected as it has ever been with GDP contributions coming from disparate parts of the world. While true, we believe investors should keep in mind that although Russia and Ukraine are the two largest countries in Europe, they represent a small portion of the world’s GDP.
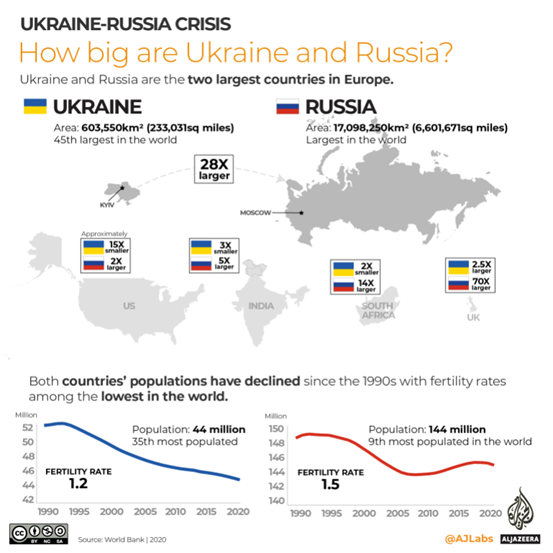
The World Bank puts the world GDP contribution from Russia at only 1.95% and only 0.14%. Of course, this number downplays the importance of the energy exports that typically flow from Russia to the rest of Europe, but economically speaking they are very small compared to some larger nations.
How much exposure does the S&P 500 have to these geographies?
Investors might digest the size of these countries in terms of world GDP and naturally ask what the exposure might be in our domestic stock market. To answer this question, we can look at data from FactSet that shows the top 10 companies from the S&P 500 that have revenue exposure to Russia and Ukraine. As the table indicates, only one company, Philip Morris International, has more than 5% of its revenues tied to business in Russia and Ukraine. The rest, are largely consumer staples companies that are defensive anyway and are unlikely to see major company-level revenue impacts even if investors were to assume an extreme and highly unlikely scenario that their revenues in these countries drop to zero.
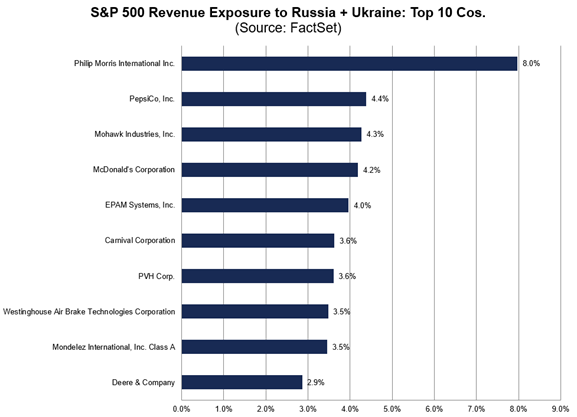
Source: FactSet
From this perspective, we believe the direct fundamental risk to the major indices is fairly limited. We think the real impact could be from investor sentiment taking a hit. However, sentiment can be fickle and is rarely negative for extended periods.
This helps explain the series of charts that follow that answer another important question that investors who want to remain objective and calm should be asking.
Historically, what has happened after the war has broken out in some parts of the world?
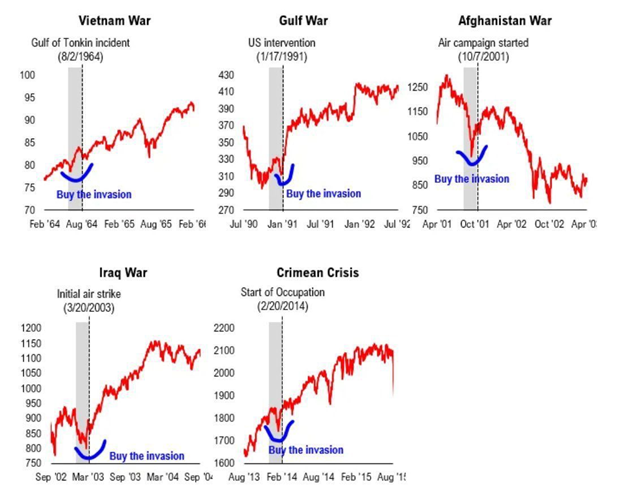
As they say, history tends to rhyme and for that reason, we believe investors should look at the history of stock market performance following major military action. The five charts that follow do a nice job showing that when war breaks out, the market tends to experience a relatively short period of volatility. However, after that initial bout of volatility, markets oftentimes settle out and sharply recover in less than 2 years, oftentimes to new highs. This has happened in 4 of the 5 conflict periods below, with the one exception being the Afghanistan War. However, we believe if it were not for it coinciding with the dot com crash, the historical record might show a similar post-conflict recovery.
Of course, things can always be different this time but over time it appears that there would be a high probability of market recovery as markets are forward-looking
All this brings us to an important set of takeaways that investors should consider during this volatile time.
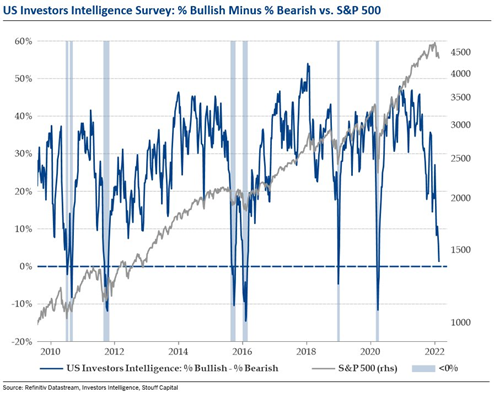
First, the negative sentiment that affects the stock market is often temporary. We think this Russia/Ukraine conflict might turn out to be a temporary concern that overtime should dissipate as we get more clarity on the international response and Russian intentions. Further, we think the last 7 weeks have helped cushion stocks a bit, as equity market volatility returned and got investors a bit more accustomed to wider intraday price changes. Moreover, we are in the middle of a meaningful correction, the first one in a long time, across major indices which have helped deflate expectations and sky-high valuations. There is no place this is more evident than in the ratio between Bullish and sentiment seen in the chart below.
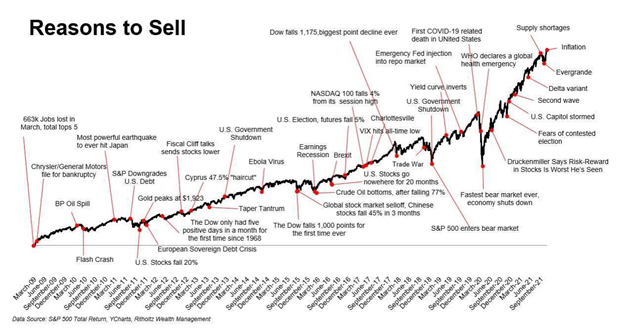
Second, as market participants, we must be keenly aware that to financial media there seems to always be a reason to sell. The chart that follows which goes back to March 2009 has a long list of reasons investors might have panicked and sold. However, as the black line representing the S&P 500 shows, these reasons did little over the long run to put a stop to a rising market trajectory. We guess that at some point we might be able to add the current Russia/Ukraine conflict to the chart and have it virtually disappear as a mere blip on the screen.
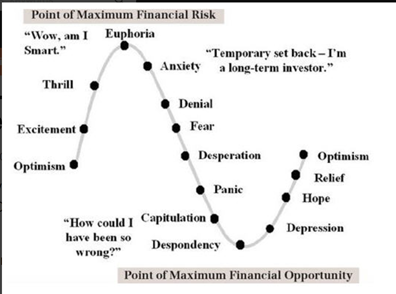
Lastly, as investors, it is oftentimes helpful to be aware of our emotions as we digest geopolitical events and the markets’ reactions to them. As the chart below indicates, it is often at the point of Euphoria that investors face the greatest risk and the point of panic where financial opportunities begin to emerge. It is important to know the difference and to act accordingly. If panic sets in, it could signal a return to a point of maximum opportunity that the long-term investor should take advantage of rather than run from, despite how uncomfortable it could feel in the moment.
Weekly Global Asset Class Performance

Disclosure:
Avidian Wealth Solutions is a registered investment adviser. Information presented is for educational purposes only and does not intend to make an offer or solicitation for the sale or purchase of any specific securities, investments, or investment strategies. Investments involve risk and, unless otherwise stated, are not guaranteed. Be sure to first consult with a qualified financial adviser and/or tax professional before implementing any strategy discussed herein. Past performance is not indicative of future performance.
Avidian Wealth Solutions may discuss and display, charts, graphs, formulas that are not intended to be used by themselves to determine which securities to buy or sell, or when to buy or sell them. Such charts and graphs offer limited information and should not be used on their own to make investment decisions.
Please read important disclosures here
Get Avidian's free market report in your inbox

Schedule a conversation
Curious about where you stand today? Schedule a meeting with our team and put your portfolio to the test.*