Published on: 07/16/2021 • 5 min read
Avidian Report – Some Datapoints Investors Should Be Watching
INSIDE THIS EDITION:
This week’s market report will be a survey of interesting data we are seeing related to the economy and capital markets. Some of these data points hold important information about the state of the economy and are interesting observations that investors may want to keep an eye on as they look for areas of opportunity and risk moving forward.
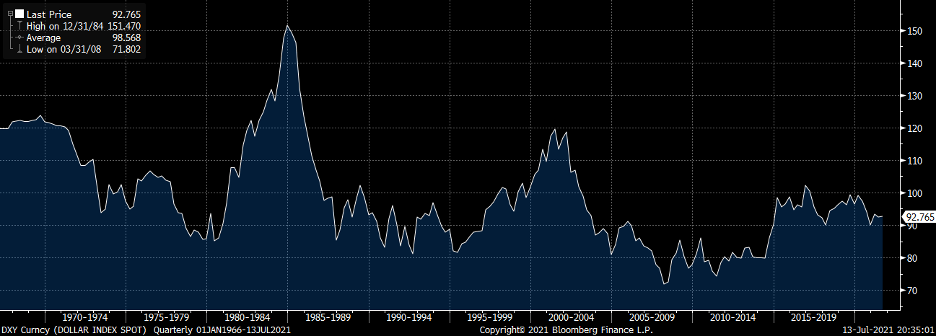
The US dollar
The US dollar is important to track because the exchange rate, or the relative price vs. other currencies, helps determine the economic standing of a country and its residents. As you might imagine, the US dollar also has a significant impact on exporters and consumers. We have been tracking the US dollar as measured by the US dollar index (DXY). We are noticing that as of late, despite some of the Fed commentary around inflation, interest rates, and investor concerns about possible tapering, the DXY looks like it is in a consolidation phase where it trades in a bit of a range. However, investors need to pay attention because, at some point in the not-too-distant future, we expect the DXY to make a break, either higher or lower, and could set up a longer-lasting trend. While we don’t know whether the US dollar will strengthen or weaken, we are certainly watching as a move in either direction could necessitate some portfolio tilts to capture opportunities ahead.
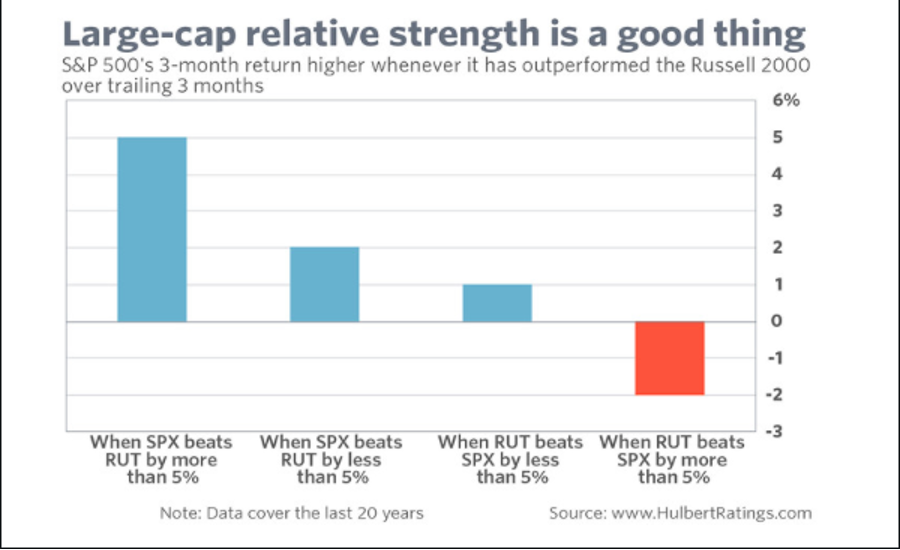
Small Cap Stocks Showing Relative Strength vs. Large Cap Stocks
In the equity market, approximately 75% of the total market cap is represented by companies in the S&P 500, a large-cap index. At the same time, only about 9% of the total market cap is represented by small-cap stocks. As of late, it is the small-cap stocks that have been outperforming large-cap stocks. However, the performance differential has narrowed some as of late. That said, we don’t think this is necessarily such a bad thing. As the chart below shows, S&P 500 3-month returns tend to be higher whenever the large-cap index has outperformed the Russell 2000 over the trailing 3-months. We think investors should be watching for any shifts in leadership between market capitalization groups because, as the chart below shows, it may provide a barometer for market direction over short time-frames.
This week’s CPI report may have surprised some people
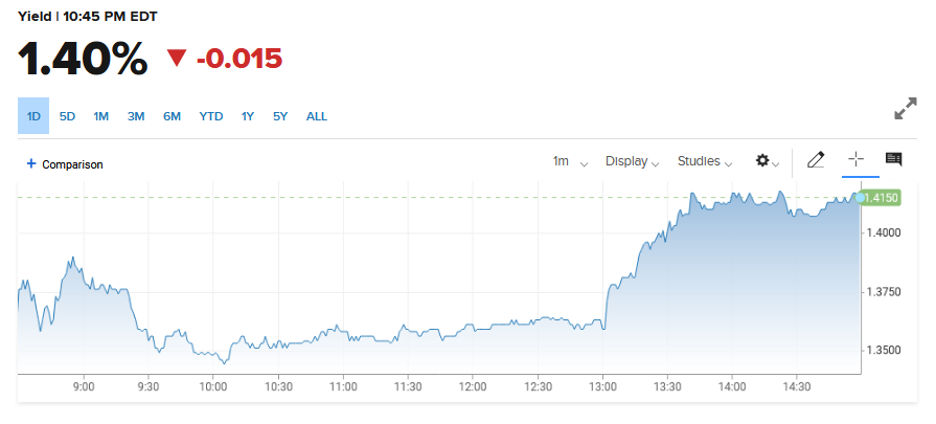
This week, we got an updated report on the Consumer Price Index (CPI). It is often used as an indicator of inflation. The report showed a 5.4% rate year-over-year and an increase of 0.9% month-over-month. Looking at the core inflation number, which excludes food and energy, we had CPI rise 4.5% year-over-year and 0.9% month-over-month. Although a large part of the increase in this report could once again be attributed to cars and pandemic-affected services, we think investors may have been a bit surprised by the higher-than-expected CPI print.


We gather this as the 10-year treasury rate reacted by moving higher. This relationship between the 10-year treasury and any comments or economic releases about inflation should be closely monitored because a major shift in the 10-year could signal a sentiment shift by investors.
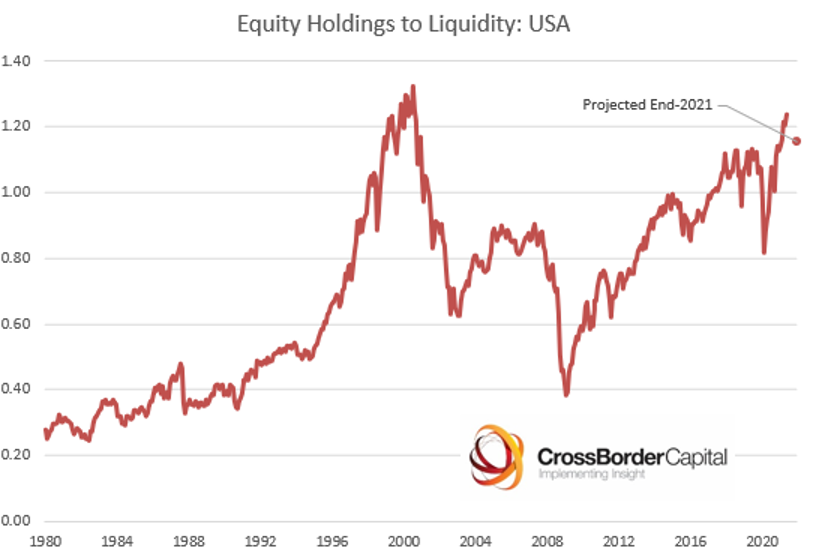
Liquidity might be reaching stretched levels
As we look at the ratio of equity holdings to liquidity, we might be reaching stretched levels. In fact, not since 1999-2000 have we seen this particular ratio reach these heights. This ratio can be looked at like a proxy of valuation and tells us a similar message to what we might get when looking at valuation metrics like the CAPE ratio.
CAPE RATIO
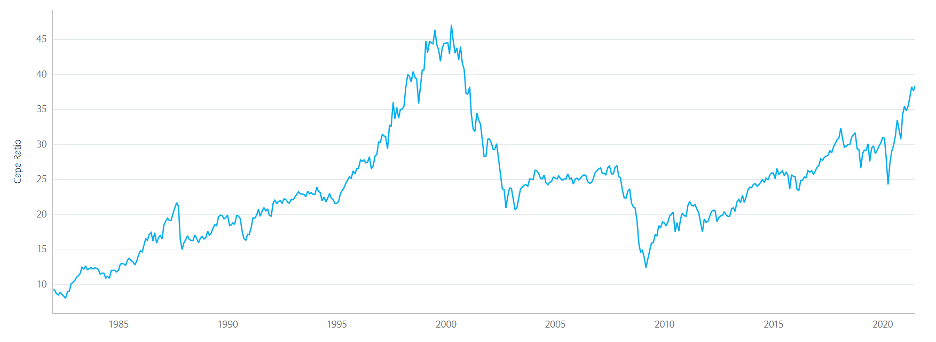
Source: Hedge Insider
So not only are stocks looking a bit stretched in terms of valuation, but this may also help explain why over the last two weeks, only 23.37% of S&P 500 constituents have made new 52-week highs. This might mean there may be some overhead resistance that needs to be broken through to get stocks moving meaningfully higher. However, it may require more clarity from the Fed to make that happen.

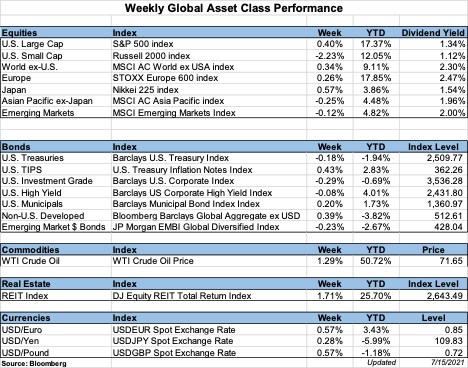
Weekly Global Asset Class Performance
Please read important disclosures here
Get Avidian's free market report in your inbox

Schedule a conversation
Curious about where you stand today? Schedule a meeting with our team and put your portfolio to the test.*