Published on: 02/04/2022 • 5 min read
Avidian Report – What Does January’s Market Performance Mean For Returns Ahead?

INSIDE THIS EDITION
What Does January’s Market Performance Mean For Returns Ahead?
Is Your Estate Plan Up To Date?
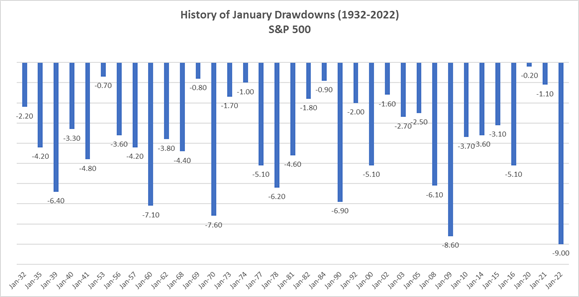
It is no secret at this point that January provided equity investors a wild ride. This is not unique, as January drawdowns have occurred numerous times going back to 1932.
Source: Avidian Wealth Solutions
However, this January is unique in a few ways. First, this was the worst January drawdown (9%) in the period, with the prior record coming January 2009 when the S&P was down 8.6%. Second, this year marked only the second time that the S&P 500 gained more than 4% over the final two trading days of January. This performance closely mirrors what we saw for the Nasdaq this month, which rallied more than 5% in the last two trading days.

Source: Bespoke Invest
Of course, investors’ looking at the rearview mirror while offering a point for context and comparison does very little to tell us what we might expect going forward. We will focus on that for the remainder of this week’s report.
First, we can look at the data over short periods following a poor January. As the table below shows, we have often seen poor February performance after January drawdowns. However, the spillover into February market prices is minimal on average. For example, after a January drawdown of greater than 5%, on average, we see February returns of -1.6%. Although that is negative and follow-through from bearish market performance in the prior months, a 1.6% decline is relatively modest.
More interesting, and at least from a historical perspective, more encouraging, is that the remaining months of the years when the S&P declined 5% or more in January see a positive average return of 2.7%. However, mixed in, some months proved unusually strong; in 2009, the S&P 500 rose 35% from February to December, and in 2016, the S&P 500 saw the final 11 months return 15.4%.

With this information, it is interesting to analyze S&P 500 performance following each negative January, rather than just the January’s with 5%+ declines. We went back to 1932 in the analysis.
As the following chart shows, subsequent 6-month performance following a negative return month in January varies substantially. However, over time, performance has often skewed positively.

Source: Avidian Wealth Solutions
Six months is a relatively short period, so for that reason, we also extended the analysis to look at subsequent one-year returns following a January decline. We gather that often the subsequent six-month returns for the S&P 500 provide a window into the possible full-year returns. Further, and more importantly, negative short-term performance does not necessarily get in the way of long-term performance over longer time horizons.

Source: Avidian Wealth Solutions
Intuitively most investors understand that short-term volatility is part of being involved in the financial markets. However, it can be challenging to remain calm and stay invested.
For that, we have some takeaways that all investors should consider.
First, drawdown periods can be opportunities to add to positions at more favorable prices. As long-term investors, these moments can turn out to be quite profitable.
Second, diversification continues to be the only free lunch in investing and is one way to smooth out volatility. Rather than having a homogenous portfolio, look to diversify between asset classes, geographies, and strategies. Having a diversified portfolio increases the probability that something in your portfolio does well at any given time.
Third, risk management matters because when markets move sharply, up or down, emotions can cause unforced errors that hurt an investor’s chance of achieving their financial goals. Remaining disciplined and objective can prevent actions you will regret later.
Lastly, the value of financial planning should not be minimized. A well-designed financial plan can set the tone for handling market volatility. When a plan is designed, it should include current return assumptions, be stress-tested via a Monte Carlo analysis with a high probability of success built into the simulation, and drive portfolio allocation decisions.

Please read important disclosures here
Get Avidian's free market report in your inbox

Schedule a conversation
Curious about where you stand today? Schedule a meeting with our team and put your portfolio to the test.*