Published on: 02/28/2020 • 5 min read
Avidian Report – Perspective for a Down Day in Equities
INSIDE THIS EDITION:
Perspective for a Down Day in Equities
Weekly Snapshot of Global Asset Class Performance
Financial Planning Goals for 2020
401k Plan Manager

This week, we saw the domestic stock market open the week by posting a drop of more than 3%. It then followed that performance on Tuesday with another down 3% day.
[toggle title=’Read More’]
The headlines, as has become customary, focused on the point drop rather than the percentage drop. Who can blame them? After all, the headline that the Dow drops 1000 points gets more attention than the Dow drops 3%.

It’s a framing decision made by the press to get views. However, for investors, it should be looked at as an opportunity to gain some perspective.
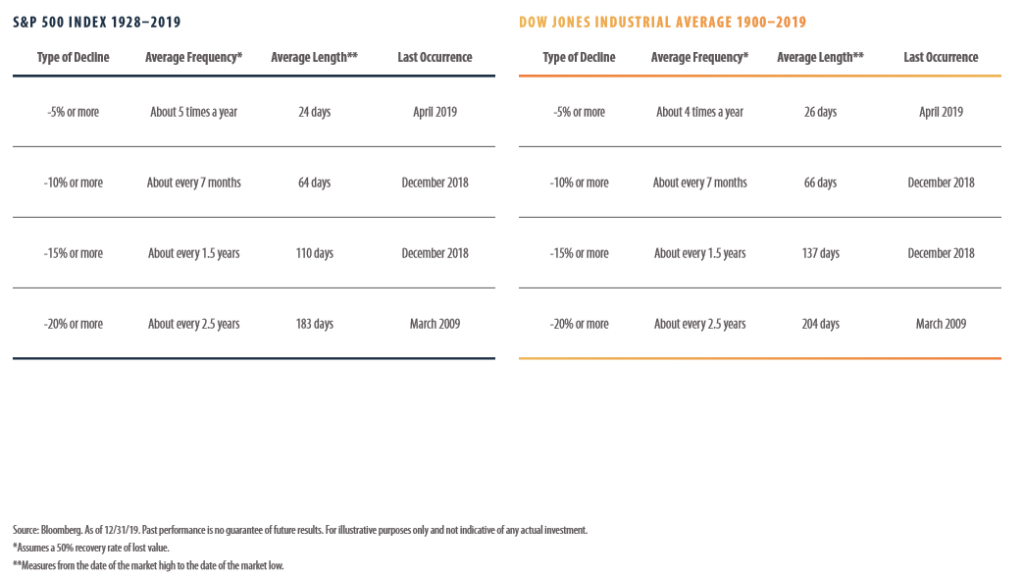
To do that, the table below may be helpful. The panel on the left shows the S&P 500 from 1928-2019 and shows the average frequency of market declines based on magnitude. The table also shows the average length of the decline and when it last occurred. As you may see, declines of 5% or more like we saw to open this week are relatively common. In fact, they have occurred on average about 5 times per year. While disquieting, those declines tend to be relatively short-lived with recovery occurring on average within 24 days. The panel on the right shows similar data for the Dow Jones Industrial Average from 1900 through 2019. Perhaps unsurprisingly, the frequency of declines for the Dow largely mirrors the frequency for the S&P.
Most investors fear these interim declines because they believe they will lead to much larger declines in short order. However, the story is different as told by history. What we find is that over the last 90 years or so, corrections and bear markets happen very frequently. This is very much in line with the data in the tables above. In fact, since 1928, there have been more than 50 corrections of at least 10%. Do you remember the one we had in mid-2015? What about the one that we had in December 2018? If you don’t, you probably have good company as volatility has remained low for the better part of three years and moves of greater than 1% become rare. As we have mentioned in previous newsletters, big drawdowns of 40%+ are relatively rare events. Going back to 1928, we have had only 7 declines for the S&P 500 of 40% or more. Going back to 1939, it has only occurred 3 times.
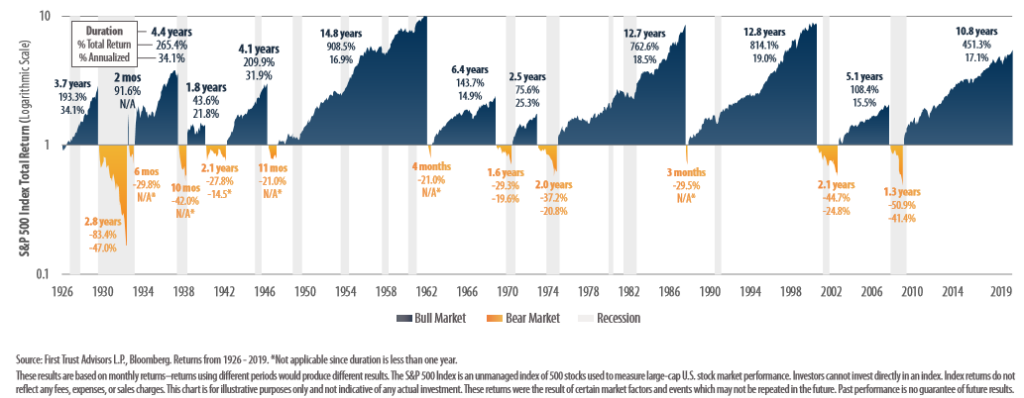
Corrections also tend to last relatively short periods of time. In fact, only 11 times have corrections or bear markets for the S&P 500 lasted longer than one calendar year. The longest bear market lasted 929 days, during the dot-com crash. In other words, beware allowing short-term market movements shake you from your strategy.
After all, while sitting out of markets during periods of volatility creates comfort, it has at least three potentially negative effects. First, it creates more difficult because not only does an investor have to be right on when to get out, but they must also be right on when to re-enter the market. Getting one of these is hard enough, trying to make the right call twice in a row is a low probability event.
Second, the timing of a rebound is unpredictable. So being on the sidelines increases the likelihood you miss a rebound. Additionally, sitting on the sidelines neutralizes the power of compounding that can occur over long periods of time.

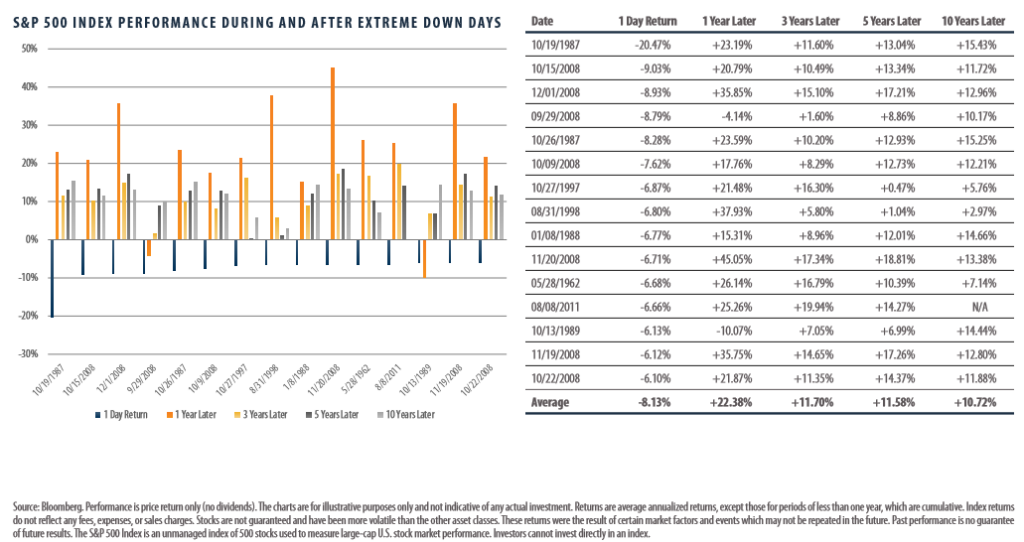
Another key point to remember after days like we have seen this week is that after large down days, the long-term has tended to still look pretty good with positive returns 1 year, 3-years, 5-years and 10-years later highly likely – at least based on history.
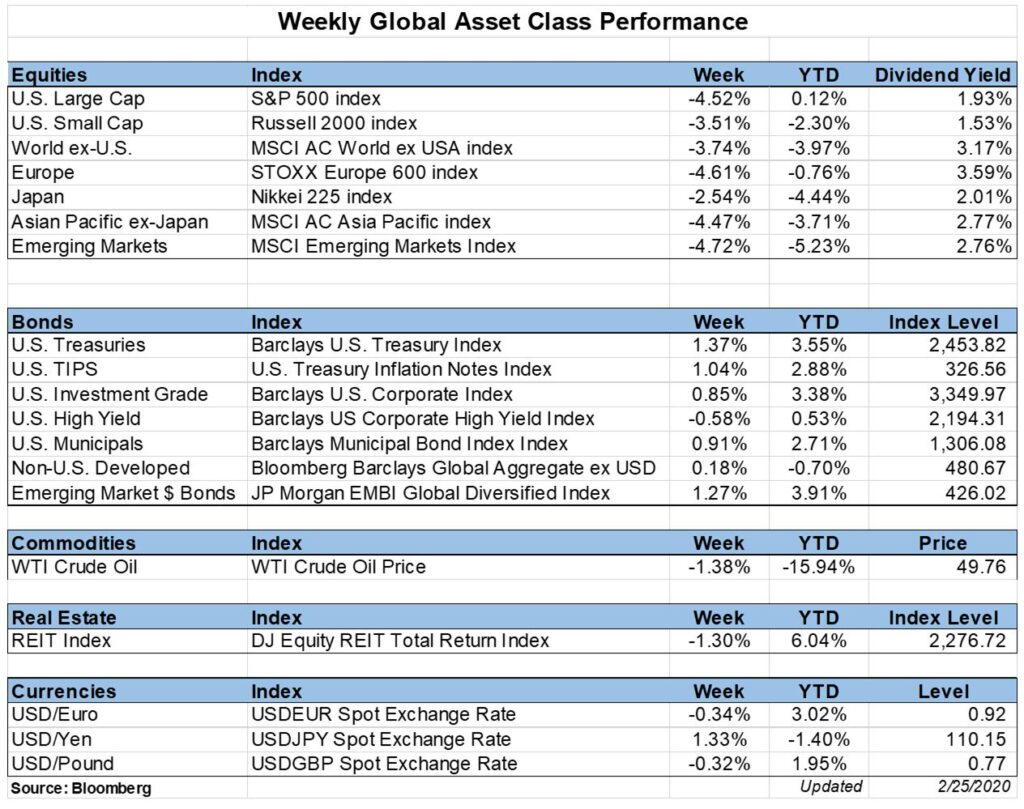
Weekly Global Asset Class Performance
[/toggle]
Financial Planning Goals for 2020
Written by Scott Bishop, MBA, CPA/PFS, CFP® and Carter Blackburn

The beginning of each year presents a unique opportunity to self-reflect about whether your Financial Plan is on track. Many of us set “New Years Resolutions” with no true actionable goal or follow-through. Remember a goal without a plan is just a wish!
With that in mind, especially given recent tax law changes and the passage of the retirement SECURE Act, now is an excellent time to review your plan to see if you are on track to meet your short and long-term goals. Below are some important areas which you should contemplate and plan before we get too far into the year.
Read Full Article Here
IMPORTANT DISCLOSURES
Financial Planning and Investment Advice offered through Avidian Wealth Management (STA), a registered investment advisor. STA does not provide tax or legal advice and the information presented here is not specific to any individual’s personal circumstances. To the extent that this material concerns tax matters or legal issues, it is not intended or written to be used, and cannot be used, by a taxpayer for the purpose of avoiding penalties that may be imposed by law. Each taxpayer should seek independent advice from a tax professional based on his or her individual circumstances. These materials are provided for general information and educational purposes based upon publicly available information from sources believed to be reliable—we cannot assure the accuracy or completeness of these materials. The information in these materials may change at any time and without notice. Use only at your own peril. As always, a copy of our current written disclosure statement discussing our services and fees continues to be available for your review upon request.
Please read important disclosures here
Get Avidian's free market report in your inbox

Schedule a conversation
Curious about where you stand today? Schedule a meeting with our team and put your portfolio to the test.*