Published on: 12/17/2021 • 6 min read
Avidian Report – Things Are Not Always What They Seem

INSIDE THIS EDITION:
Things Are Not Always What They Seem
Year End Tax Planning Checklist 2021
Money Hour Radio Show Announcement
Things Are Not Always What They Seem
Let’s just go ahead and put it out there, the broad market indices have been on a tear all year. In fact, the S&P 500 has not had a drawdown of greater than 6% since the start of 2021. This is both wonderful for the equity investor trying to avoid volatility and misleading. The truth is that if we were only looking at the broad indices, we would assume that all was well in all corners of the market and that volatility had pretty much dried up. However, things are not always what they seem.
In reality, we have seen quite a bit of carnage under the surface in several corners of the market over the last few months. In technology stocks, in the shares of Special Purpose Acquisition Companies (SPACs), and in the shares of COVID-19 darlings the story has been very different than what has been portrayed by the index levels. This is highly attributable to the concentration at the top of the indices and how well the largest four or five stocks have performed all year.
This week we go under the hood to see what has really been going on outside of the broad indices and put into perspective some of the risks that may be lurking out there.
First, we can take a look at the moving averages. As the chart below shows, the percentage of index constituents that are trading above their 200-day moving averages has been in a steady decline since April. This goes for the S&P 500, the NASDAQ Composite Index, and the Russel 2000, although the weakest of the bunch has been NASDAQ.
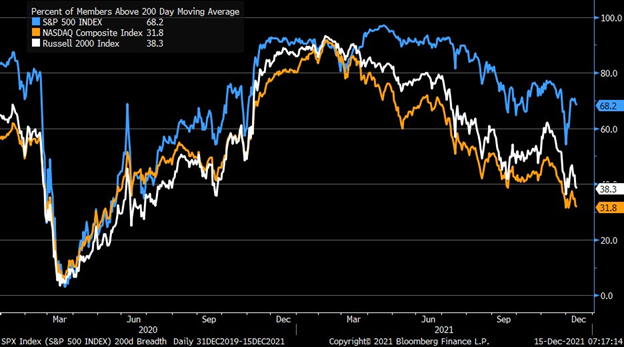
Source: Bloomberg
In the inverse, we can also look at the percentage of companies that are trading above their 50-day moving average. Here, we see a similar weakness in the NASDAQ Composite Index with only 21.8% of companies trading above their 50-day moving average.
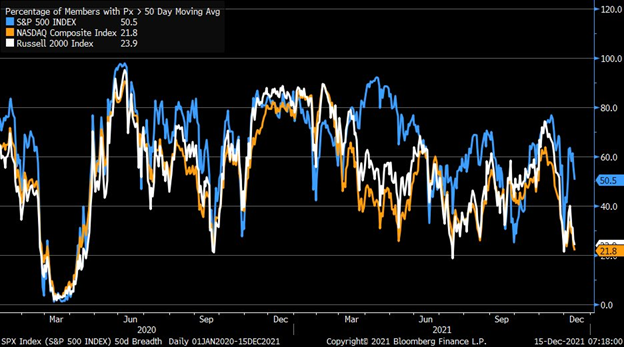
Source: Bloomberg
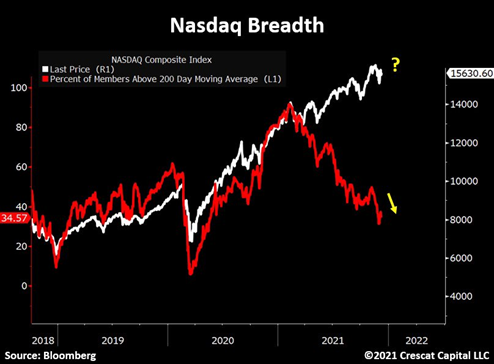
Nasdaq is less than 3% from all-time highs. At the same time, approximately 35% of its members are above their 200-day moving average. This represents a pretty meaningful deterioration in the breath which only happened previously during the peak of the tech bubble at the turn of the century.
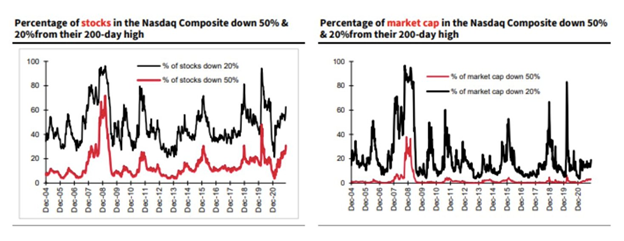
The two charts below paint the same information but with a slight twist which shows both the percentage of stocks in the Nasdaq composite down 50% and 20% from their 200-day highs as well as the percentage of market cap in the Nasdaq down 50% and 20% from their 200-day highs. The key takeaway is that the largest companies by market cap, those supporting index performance this year, are doing far better than the rest.
Of course, earlier we mentioned the SPAC market and how that was similarly suffering in silence. The chart below shows the S&P 500 on an uptrend while the IPOX SPAC Index has been in steady decline since February. Again, indicating some underlying weakness.
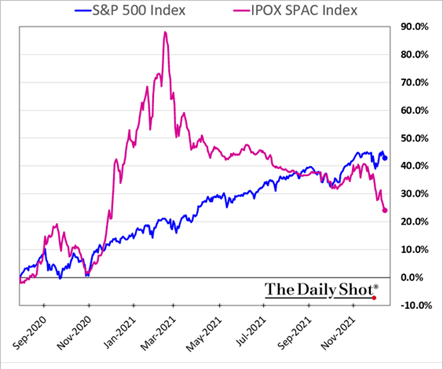
Source: The Daily Shot
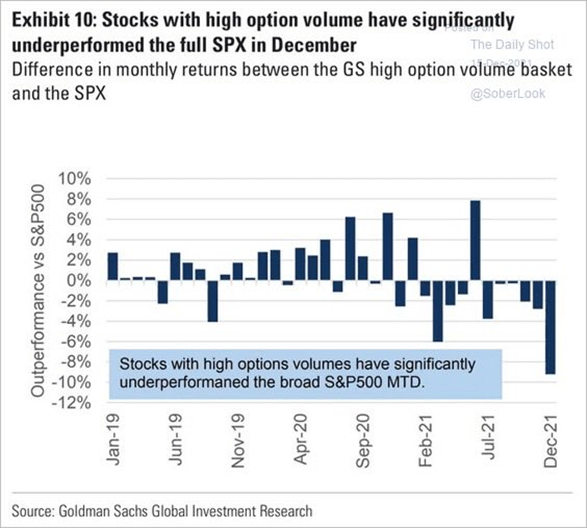
Going back to last year, we had stocked with high options volume considerably outperforming the S&P 500. This as meme-stocks and fed stocks took off with rampant retail speculation. However, this year, the tape has reversed course and we now see those same stocks with high options volume significantly underperforming the S&P 500. Especially during the month of December.
And it isn’t only these stocks that have reversed course. COVID-19 darlings which turned in fantastic performance during the height of the pandemic have also turned lower. Take the shares of Zoom and Peloton which zoomed to all-time highs during 2020. They are now coming back down to earth.
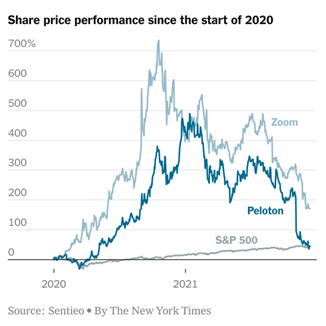
Which we believe is a great reminder that things in markets tend to revert. The leaders today will at some point lag and the laggards lead. For investors, it is important to remember this because it will keep them from engaging in performance chasing which can be hazardous to your wealth.
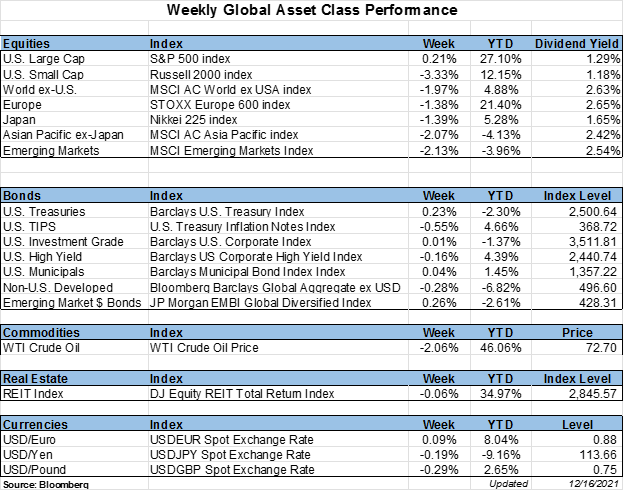
Weekly Global Asset Class Performance
MONEY HOUR RADIO SHOW ANNOUNCEMENT
As our firm grows and becomes more dynamic, our desire is to always find more ways to enhance your experience in working with our firm. After much deliberation, we want to announce we will be wrapping up our daily radio show, The Money Hour. The last airing will be Friday, December 17th, 2021. We greatly appreciate all of you who have listened to the show for many years.
In place of the Show, we are planning to do a monthly podcast starting in 2022. Moving forward, we will be using podcasting and video to bring you new and helpful content from our executives, advisors, and other members of the Avidian Wealth team. Our podcasts will be available on all major platforms, as well as our YouTube channel here https://www.youtube.com/channel/UCo90q2IcXGvfUc4ptnr3uWA.
The Money Hour Show, December 17, 2021
Please read important disclosures here
Get Avidian's free market report in your inbox

Schedule a conversation
Curious about where you stand today? Schedule a meeting with our team and put your portfolio to the test.*